The NYPD’s Compstat: compare statistics or compose statistics?
by John A. Eterno† and Eli B. Silverman‡
†(Corresponding author) Department of Criminal Justice, Molloy College, 1000 Hempstead Avenue, PO Box 5002, New York, NY 11571-5002, USA. Tel:+1 1516 678 5000 ext. 6135; Fax: +1 516 256 2289; email jeterno@molloy.edu
‡John Jay College of Criminal Justice, 899 Tenth Avenue, New York, NY 10019, USA. Tel: 845 357 0685; email: Estcompany@optonline.net
Submitted 22 January 2010; revision submitted 19 March 2010; accepted 6 April 2010
International Journal of Police Science and Management, DOI: 10.1350/ijps.2010.00.0.195
NOTICE: THIS WORK MAY BE PROTECTED BY COPYRIGHT
YOU ARE REQUIRED TO READ THE COPYRIGHT NOTICE AT THIS LINK BEFORE YOU READ THE FOLLOWING WORK, THAT IS AVAILABLE SOLELY FOR PRIVATE STUDY, SCHOLARSHIP OR RESEARCH PURSUANT TO 17 U.S.C. SECTION 107 AND 108. IN THE EVENT THAT THE LIBRARY DETERMINES THAT UNLAWFUL COPYING OF THIS WORK HAS OCCURRED, THE LIBRARY HAS THE RIGHT TO BLOCK THE I.P. ADDRESS AT WHICH THE UNLAWFUL COPYING APPEARED TO HAVE OCCURRED. THANK YOU FOR RESPECTING THE RIGHTS OF COPYRIGHT OWNERS.
John A. Eterno PhD is chairperson and associate dean of graduate studies in criminal justice at Molloy College. He is a retired captain from the NYPD. He is managing editor of Police Practice and Research: An International Journal. His books include Policing within the Law: A Case Study of the New York City Police Department, and Police Practices in Global Perspective (with Dilip Das). His peer reviewed articles are in various publications such as Professional Issues in Criminal Justice, International Journal of Police Science and Management, Women and Criminal Justice, and Criminal Law Bulletin.
Eli B. Silverman PhD is Professor Emeritus at John Jay College of Criminal Justice and the Graduate Center of CUNY. He has previously served with the US Department of Justice and the National Academy of Public Administration in Washington DC and was Visiting Exchange Professor at the Police Staff College in Bramshill, England. He has lectured and consulted with numerous police agencies in the US, Europe, Central and South Americas, Asia and Australia. His recent publications include: NYPD Battles Crime: Innovative Strategies in Policing, and peer reviewed articles featured in the International Journal of Police Science and Management and the British Journal of Community Justice.
ABSTRACT
The New York City Police Department (NYPD) introduced Compstat in 1994. Since then, the NYPD and many other law enforcement agencies which have adopted Compstat, have declared dramatic decreases in reported index crime. Indeed, in New York City the claim is that index crime has decreased over 76 per cent. Using both quantitative and qualitative methods, this research examines Compstat’s managerial environment. Our main concern in this paper is examining the extent (if any) of pressures which managers believe they are exposed to at Compstat, as well as how those pressures might influence unethical crime reporting. Results indicate that managers perceive that they are subject to significantly greater pressure in the Compstat era especially, but not exclusively, with respect to decreasing index crime. Further, these pressures help explain unethical crime reporting in the Compstat era.
INTRODUCTION
Rarely has a development in policing evoked such a wide range of attention and opinion in both the academic literature and popular press. Compstat (short for compare statistics) is the New York City Police Department’s (NYPD) central management accountability model whereby commanders are held responsible for crime in their areas. Compstat features up-to-date computerised crime data, crime analysis and advanced crime mapping as the basis for regularised interactive crime strategy meetings which hold police managers accountable for specific crime strategies and solutions.
Initial assessments portrayed Compstat as an effective managerial crime-reduction accountability device (Bratton, 1997; Bratton & Knobler, 1998; DeLorenzi, Shane, & Amendola, 2006; Geoghehgan, 2006; Gurwitt, 1998; Kelling & Sousa, 2001; MacDonald, 2002; Maple & Mitchell 2000; Moore, 2003; O’Connell & Straub, 1999; Safir, 1998; Sanow, 2003; Schick, 2004; Silverman, 2001; Walsh, 2001; Walsh & Vito, 2004).
Some more recent Compstat appraisals, however, have offered significant reservations regarding Compstat’s managerial effectiveness, the reliability of its crime statistics and/or the extent of its organisational reform (Dabney, 2010; Eck & Maguire, 2000; Eterno & Silverman, 2006; Harcourt, 2001; Harcourt & Ludwig 2006; Joanes, 2006; Karmen, 2000; Levitt, 2004; Messner et al., 2007; Rosenfeld, 2007; Rosenfeld, Fornango, & Baumer, 2005; Rosenfeld, Fornango, & Rengifo, 2007; Skogan & Frydel, 2003; Weisburd, Mastrofski, McNally, Greenspan, & Willis, 2003; Weisburd, Willis, & Greenspan 2006). Some critics claim that police middle managers are under substantial organisational pressure to contain crime in their areas. These detractors maintain that these pressures are reflected in an overemphasis on numbers and statistical performance management (Martin, 2003).
In New York City, these critical appraisals have been primarily fuelled by anecdotal accounts. With this in mind, this paper offers the first systematic survey of commanders who have been active in the NYPD Compstat process, the law enforcement agency which first introduced Compstat.
We sought to ascertain if: (1) Compstat was perceived by mid-level managers as adding pressure to lower their crime rates; and (2) if so, was this pressure perceived as contributing to inaccurate crime statistics? A questionnaire was specifically designed to elicit frank and candid understanding of the dynamics of middle-management operations and interface with higher NYPD echelons. This paper consists of four sections. To provide the context for our analysis, this paper first reviews literature relevant to the controversy surrounding Compstat. The second section discusses our research approach, while the third section provides an analysis of our findings. The concluding section discusses the limitations of this study and the implications of the findings for international crime statistics.
THE INTERNATIONAL COMPSTAT CONTROVERSY
Since Compstat has been adopted throughout the United States (within its first six years, more than a third of US cities with 100 or more officers claimed to have adopted Compstat [Weisburd et. al. 2001]) and, in many other countries, the issues raised by the controversy have international ramifications. This can be observed in New York, other American cities, and internationally beyond the US.
New York
Compstat’s first three years corresponded with dramatic declines in the city’s crime rate coupled with many accolades. The city’s 12 per cent decline in 1994 (compared with a national drop of less than 2 per cent) grew to 16 per cent in 1995 and maintained 16 per cent in 1996. These decreases accounted for more than 60 per cent of the national decline during this period (Silverman, 2001). Between the calendar years 1990 and 2008, according to the New York City Police Department (NYPD), major crimes declined over 76 per cent while homicide also declined almost 77 per cent.
On the other hand, it has been suggested that Compstat is now used by NYPD headquarters to bear down on the management of many street operations in order to lower the crime rate. Numbers, sometimes any numbers, rule the day. This ratcheted system, in the words of one participant, is ‘wound up too tight’. A 20-year veteran Brooklyn detective put it this way, ‘Compstat is everything. People are tired of being harassed, searched and frisked, and run off the streets. People are fed up; the cops are, too’ (Marzulli & O’Shaughnessy, 2000, p. 17).
There have been numerous press reports critiquing New York City crime statistics. In 2003, New York police officials revealed that more than 200 felonies committed in the Manhattan’s 10th precinct in the previous year were improperly downgraded as misdemeanours, making the crime rate in the area appear lower than it really was.1 According to Rashbaum (2003, p. B5):
Because the reported crimes were wrongly downgraded, the 10th precinct . . . recorded just 811 serious crimes at the end of 2002, compared with 876 in 2001, for a 7.42 per cent drop, according to police statistics. Without the changes, serious crime in the precinct would show an increase for 2002 of about 16 per cent, to more than 1,000 crimes, while the city over all had a modest decrease of 5.32 per cent, according to department statistics.
[Since Compstat went into effect] at least five police commanders have been accused of reclassifying crimes to improve their statistics, which are reviewed at sometimes contentious weekly Compstat meetings.
Two years later, a reporter analysed a 44 per cent increase in NYPD reports of lost property (a misdemeanour) between 1997 and 2004, while grand larcenies (a felony) experienced steep declines. The author suggests that this is an example of downgrading crime in order to reduce the rate of major crimes (Moses, 2005).
New York City’s own Patrolmen’s Benevolent Association presented a similar critique of Compstat (Zink, 2004):
It was a great idea that has been corrupted by human nature. The Compstat program that made NYPD commanders accountable for controlling crime has degenerated into a situation where the police leadership presses subordinates to keep numbers low by any means necessary. The department’s middle managers will do anything to avoid being dragged onto the carpet at the weekly Compstat meetings . . .
So how do you fake a crime decrease? It’s pretty simple. Don’t file reports, misclassify crimes from felonies to misdemeanors, under-value the property lost to crime so it’s not a felony, and report a series of crimes as a single event. A particularly insidious way to fudge the numbers is to make it difficult or impossible for people to report crimes — in other words, make the victims feel like criminals so they walk away just to spare themselves further pain and suffering.
As recently as February 2010, a New York police officer reported that his precinct ‘recorded felonies as misdemeanors and refused to take complaints from victims — all in an effort to drive down the crime rate’ (Parascondola, 2010). Following other related accounts of crime manipulation, New York’s Citizen Crime Commission, ‘a civic group that usually backs the NYPD urged the department to release internal audits of crime statistics to assure the public that the numbers can be believed’ (Parascandola, 2010).
Other American cities
This Compstat allure of crime reduction, through technological advancement, is reflected in an in-depth study of the Lowell Police Department’s Compstat (Willis, Mastrofski, Weisburd, & Greenspan, 2003a, p. 11):
What police department, however, would not want to adopt a program whose clear purpose is to reduce crime through the implementation of a well-defined set of technologies and procedures? The appeal of Compstat’s crime fighting goal to the police increases the likelihood that it will endure.
Compstat crime reduction efficacy is frequently advocated by police administrators, several of whom moved from the NYPD to head other city police departments. Compstat’s introduction in New Orleans, for example, corresponded with a reported decline in murders from 421 in 1994, diving 55 per cent in 1999 to 162. Minneapolis’s version of Compstat, CODEFOR (Computer Optimised Deployment-focus on Results), has been credited for a double-digit decrease in homicides, aggravated assaults, robberies, burglaries and auto thefts between 1998 and 1999 (Anderson, 2001, p. 4). In 2000, Compstat was introduced in Baltimore by its new chief, a former NYPD deputy police commissioner. By the end of the year, the city experienced below 300 homicides for the first time in 20 years, accompanied by an overall crime drop of 25 per cent (Anderson, p. 4; Clines, 2001, p. 15; Weissenstein, 2003, p. 27). Between 1999 and 2001, Baltimore’s overall violent crime declined 24 per cent, homicides dropped 15 per cent, shootings fell 34 per cent, robberies dropped 28 per cent, rapes 20 per cent and assaults 21 per cent (Henry, 2002, p. 307). Philadelphia’s former police commissioner, another former NYPD deputy police commissioner, attributed a decline in the city’s crime to Compstat-driven policing.
On the other hand, concerns have been raised in many jurisdictions that Compstat has served as a catalyst to inaccurate law enforcement statistical measurement (Long & Silverman, 2005; Manning, 2001; Willis et al., 2003b). When this type of system becomes excessively supervised, whether within a highly centralised organisation or from external political or hierarchical organisations, the consequences can be alarming. Subordinate units will naturally concentrate on those items being measured. Or, as the saying goes, ‘what gets measured gets done’. This can lead to crime statistics manipulation and/or downgrading, which has been reported in numerous locales including Philadelphia, Atlanta (Hart, 2004, p. 6), New Orleans (Ritea, 2003a, p. 1, 2003b, p. 1), New York (Gardiner & Levitt, 2003, p. 8; Parascandola & Levitt, 2004, p. 5) and Broward County, Florida (Hernandez, O’Boye, & O’Neill, 2004, p. 9). In Philadelphia, charges of altered crime reports emerged after the police department introduced Compstat. ‘If a person was punched in the eye, it might have been written up as a hospital report, so it didn’t reflect a crime had occurred’, reported one Philadelphia police official (Webber & Robinson, 2003).
International examples
Internationally, Compstat-like performance management systems have also been subjected to controversial claims. In the United Kingdom, for example, commentators have cited the ‘emergence of US style criminal justice policies in other industrial democracies’ (Jones & Newburn, 1997, p. 123).
Like the NYPD Compstat model, the UK approach stresses police results and outputs through the setting of explicit and measurable crime level indicators (Clark & Newman, 1997). There have been numerous UK manifestations of police performance management criteria dating back to 1983 (Jones & Silverman, 1984).
In 1997 the UK government directed the police forces to achieve ‘best value’ and ‘crime reduction targets’ (McLaughlin, 2007, p. 184) through ‘league tables, ranking and performance measures’ (Loveday, 2005, p. 150).
Yet reviews suggest that crime statistical performance indicators might create ‘perverse incentives [that] compromise local innovation, efficiency and accountability’ (Flanagan, 2008, p. 21). The collection and recording of crime statistics was questioned in a report entitled ‘Collection and Accuracy of Police Incident Data’, commissioned by the Home Office in 1996, which stated, ‘there appears to be some variation not only in the number and type of events being recorded by the police, but also in the way certain events are interpreted for statistical purposes’ (Portas & Mason, 1996, p. 24). A Home Office (2000) report revealed significant under-recording of crime by the police.
Other evidence suggested that in some cases crimes were reclassified so that burglary was recorded as criminal damage or other type of theft (Loveday, 1996). In 1999, a Police Complaints Authority investigation into recording practices in one force found that over 9,000 crimes were absent from official crime figures, indicating that the force’s crime recording policy ‘was designed to have the effect of artificially reducing recorded crime to a more politically acceptable level’ (Davies, 1999, p. 3; for a fuller discussion see Hallam, 2009).
In addition to academic and government analyses, the popular press has publicised distorted crime statistics. In October 2008, it was reported (‘Violent crime soars’, 2008) that:
Some police forces have been under-recording the most serious violent crimes, the Home Office said today, as it released figures showing a 22% increase. The category includes serious assault, murder, attempted murder and manslaughter.
Officials admitted the under-counting could have been going on for more than 10 years. They said 13 forces were asked to re-examine their figures after they discovered some serious assaults were being recorded in a lower category of offence.
Two months later, the head of the UK Statistics Authority accused the Home office of releasing ‘selective’ knife-crime figures in order to downplay the extent of knife stabbings (Booth, 2008). By April 2009, a respected Home Office adviser observed that the public had little confidence in the accuracy of the government’s crime statistics (Whitehead, 2009).
An in-depth analysis of three UK police forces involved in Compstat-like performance management activity concluded that ‘. . . the conflicting priorities brought about by managerial dictum and the bureaucratic rules governing the recording of crime are to define crime down. It leads to a manipulation of data to provide pleasing results’ (Hallam, 2009, III). Another UK study referred to ‘repeated reports of the massaging of figures by the police’ (Martin, 2003, p. 161).
In Australia, Compstat-like performance management systems were also modelled after New York’s Compstat. Queensland’s Police Service version of Compstat is known as Operational Performance Review (OPR). One study found the introduction of OPR ‘associated with a significant decrease in the total number of reported offences’ (Mazerolle, Rombouts, & McBroom, 2007).
The country’s largest police force, the New South Wales police, developed its Operations and Crime Review (OCR) management system after visits to NYPD’s Compstat (Davis & Coleman, 2000). A previous commissioner stressed that OCR policing is data driven, ‘uncompromising difficult and stressful’ (Ryan, 2000 cited in Kennedy 2010).
Like elsewhere, Australian performance-based policing is controversial. On the one hand, for example, two Australian scholars’ evaluation of the OCR found this process to be effective in reducing three of the four offence categories studied (Chilvers & Weatherburn, 2004). Yet a 2000 evaluation by an independent consulting group (Hay Group Consulting Consortium, 2000) found communication to be largely a oneway process with little feedback to commanders, ‘reinforcing the culture of fear and punishment’. The following year, the deputy commissioner resigned after he announced that crime was falling when the Bureau of Crime Statistics said it was increasing (Kennedy, 2000, p. 27).
Australia’s National Uniform Crime Statistics Committee reported variations in crime statistics due to ‘. . . the extent of unreported crime; inadequacies in offence definitions, counting rules and offence classifications; procedural differences such as the offences under which an offender may be charged; differences in the way statistics are compiled as a result of the lack of uniformity in systems used and noncompliance with the rules governing the collation of statistics’ (Hallam, 2009, p. 55) Carach and Makkai (2002) found that recorded crime statistics in the State of Victoria varied depending on whether an evidential or prima facie approach was applied by officers involved in the crime recording process.
The current study focuses on the reliability of crime statistics in the law enforcement agency which has the longest-running and most widely publicised Compstat process. It has been over 15 years since the NYPD first introduced Compstat to law enforcement. We now turn to our research approach and findings.
Naturally, a number of criminologists were highly skeptical. Some doubted the numbers; but the numbers were probably the most reliable ever, since Bratton had introduced a new system for checking, double-checking, and triple-checking crime activity and police reports throughout the 76 precincts.
-- Body Count: Moral Poverty ... And How to Win America's War Against Crime and Drugs, by William J. Bennett, John J. Dilulio, Jr., John P. Walters
RESEARCH APPROACH
In this study, we examine the managerial environment which shapes Compstat practice in the NYPD. We do this using both quantitative and qualitative methods. Essentially, quantitative methods are used to gauge the levels of perceived organisational pressure as well as possible adverse consequences of those pressures on the ranks of captain and above. This includes the ranks of deputy inspectors, inspectors, and deputy chiefs who may command precincts, detective, transit, housing and other operational units. Qualitative methods, on the other hand, are used to develop a theoretical understanding of the data collected and to present those data in an accurate and comprehensible way.
Given that the NYPD (like many organisations) may not necessarily be forthcoming with information regarding questionable aspects of its widely publicised style of policing, we required an innovative research approach.2 The cornerstones of our methodology are a self-report, anonymous, mailed survey with retired members of the NYPD in the ranks of captain and above, as well as in-depth interviews with various ranks. Surveys, when properly designed, allow researchers to examine sensitive issues such as drug use by juveniles or sexual behaviour. One important aspect of a survey, then, is its construction. In order to ensure that the survey was properly constructed, we spent months in the development process with the assistance of other researchers and focus groups including retired and current NYPD personnel. The focus groups were limited to four participants to allow for discussion and review of the questions. They added several questions, revised wording and helped test the instrument. All advised that the questions were understandable and the instrument was concise. Other researchers, including but not limited to Molloy College’s Institutional Review Board, advised that the instrument and methods were excellent for the purposes of scientifically examining the NYPD’s managerial process. Further, subjects were well protected by the research design and instrument. Ultimately, after numerous drafts, a finalised survey was constructed. 3 The survey is short and easily self-administered. It is only two pages (ie, four sides) long. This is an important feature in that lengthy questionnaires can adversely influence response rate (see Neuman, 2000).
The sampling design is very important as well. The population studied is NYPD retirees in the ranks of captain and above. Using retirees is an important element of the method since these managers do not fear retaliation and, therefore, have a level of comfort that enables them to respond fully. To protect subjects further, and just as crucial to the method, is the use of anonymity for those administered the survey. Anonymity is an essential feature to a study examining sensitive questions (eg, illegal and/or unethical behaviour). Research on the use of questionnaires indicates that anonymity is an indispensable tool helping address the possibility of social bias in answers. Specifically, anonymity helps to achieve valid responses (Babbie, 1989; Bradburn, 1983; Dillman, 1983; Neuman, 2000). Bradburn (p. 298), for example, writes, ‘With sensitive questions or those associated with a high degree of social desirability, the more anonymous methods of administration appear to work somewhat better’. Neuman (p. 258) puts it quite succinctly, ‘Survey methods that permit greatest anonymity are better for threatening questions. Thus, more honest answers may come from mail . . . questionnaires . . .’. We therefore chose a self-administered, mail questionnaire design that permits maximum anonymity of subjects.
Keeping the questionnaire very short and maintaining anonymity are key features that help increase sample size and validity, respectively. In our best judgment, the need for these features is critical. However, their use necessarily causes some trade-offs. For example, certain questions must be eliminated or simply cannot be asked, either to save space or to ensure anonymity. Although one may question such trade-offs, they were not made haphazardly but based on carefully considered scientific reasoning.4
The instrument was mailed to all retirees in the ranks of captain and above, with a cover letter, in September 2008. The use of regular mail generally has the advantage of protecting respondents better than an internet or email design (eg, use of cookies, possible hacking of responses, tracking computer messages and so forth (see Hagan, 2006). The cover letter was signed by the principal researchers and the Captain’s Endowment Association (CEA) president in order to secure the widest range of cooperation. In the letter we ask for the respondent’s cooperation in helping us obtain accurate information on the NYPD. We also sent a reminder postcard in December. By February 2009, we had a final return of 491 completed questionnaires. This represents a 41 per cent response rate. For retired New York City civil servants, this is considered a good return.
The sample consists of 166 (33.9 per cent) respondents who retired before 1995 (the first full year of Compstat in New York City — it began in early 1994) and 323 (66.1 per cent) who retired 1995 and after.5 These percentages closely comport with the known levels of retirees who are in those categories. Furthermore, there were 263 (54.1 per cent) captains, 98 (20.2 per cent) deputy inspectors, 63 (13 per cent) inspectors, 28 (5.8 per cent) deputy chiefs, and 34 (7 per cent) others.6 These percentages also approximate the ranks of those retired.7 These data increase our confidence that there is little, if any, non-response bias. Additionally, this provides an excellent sample for comparing two important groups — the first group is those who never worked under a Compstat management system and the second is those who did work during the Compstat era.
In addition to the self-report survey, the authors conducted in-depth interviews with 10 retired members of the NYPD. While these interviews are not a representative sampling of the entire police department, they do include various ranks from police officer through deputy chief: one police officer, one sergeant, three captains, two deputy inspectors, two inspectors and one deputy chief. All worked during the Compstat era. Two worked regularly with Compstat in headquarters. All were in good standing and remain so at this time. All retired after serving the department until eligible to retire and none had any serious disciplinary problems. These members volunteered to assist us with the research by contacting us or advising us they would help.
The data for the qualitative portion of the study were gathered through unstructured interviews. These unstructured interviews are similar to what is called ‘informal conversational interview’. As Maxfield and Babbie (2009, p. 205) state, ‘. . . the interviewer establishes a general direction for the conversations and pursues specific topics raised by the respondent. Ideally, the respondent does most of the talking’. This was the case with us, as respondents were full of information that they wanted to share. The interviews generally lasted about an hour to an hour-and-a-half. They were casual and took place either through a conference call or in an office atmosphere.
Both researchers were present for every interview. There are advantages to both researchers working in tandem. First, we were both present to ensure that we both fully understood. If not, either could clarify what was being said. Second, both of us are witnesses to what is being said. Therefore, we can corroborate the statements of respondents. Third, this enhances the reliability of the data in that two separate researchers agree with the information collected. Further, after each interview, the researchers compared notes to be sure that the substance of the interview was properly recorded. Last, if necessary, follow-up calls can be done by either researcher to clarify information that may have been unclear.
Both authors have also been extensively involved in other research on NYPD and Compstat (see, eg, Eterno, 2001, 2003; Eterno & Silverman, 2006; Silverman, 2001; Silverman & O’Connell, 1998). Also, one of the principal researchers is a retired captain from the NYPD, has attended Compstat meetings, and has discussed these issues with many of his colleagues.8 Additionally, the other principal researcher has written what some consider one of the preeminent explorations of Compstat. Further, he has attended numerous Compstat meetings and has interviewed many members of NYPD in conducting that research. Collectively, these experiences and studies inform our understanding of NYPD and these data.
ANALYSIS AND RESULTS
Throughout this paper, we develop our understanding of NYPD using both quantitative (primarily) and qualitative (supplementary) methods. In this section, we focus on quantitative analysis. However, interpretation of these data and results is also informed by the qualitative research (personal interviews) and our collective understandings of NYPD and Compstat. Our research focus in this paper is on the extent to which managerial style, especially Compstat pressures and the like, influence (if at all) the accuracy of crime statistics.
We use several statistical approaches to analyse the survey data. First, we use a comparison of means, examining the responses of those who worked during the Compstat era versus those who did not. This gives us baseline measurements comparing pressure during pre- and post- Compstat eras. Next, we examine the responses of those who worked during the Compstat era with respect to their self-reported pressures and changing of crime reports. At a minimum, this will show the extent (if any) of adjustment of crime reports. Lastly, we conduct a multivariate ordinary least squares regression analysis to attempt to explain the unethical modification of crime reports that respondents reported during the Compstat era. We supplement these quantitative data with qualitative data to help understand the nature of the findings and guide the research.
Compstat era perceptions of pressure compared with non-Compstat era perceptions
The first analysis is a comparison of means for those who worked after 1994 compared with those who worked earlier years (ie, those who worked during Compstat compared with those who never worked under Compstat) (see Table 1).9 If there are no statistical differences between these eras, then these variables are not likely to be relevant to our research questions.
Nearly every variable demonstrates higher levels of managerial pressure perceived by those who worked during the Compstat era. As noted in Table 1, this is particularly evident in such areas as reducing index crime, increasing numbers of arrests and summonses, and even reducing civilian complaints. One exception to this is pressure to maintain integrity in crime statistics. For this variable, pressure is significantly greater in the pre-Compstat era. Further, the only variable that does not reach the level of statistical significance is pressure to find victims of child abuse.
For the purposes of this study, we focus on three key variables in the survey: (1) the amount of pressure to decrease index crime; (2) the level of NYPD promotions based on crime statistics; and (3) the extent of management’s demand for integrity in crime statistics. These variables establish a foundation for further analysis by showing respondents’ varying perceptions before and after Compstat. Further, comments by our respondents indicate that these are critical variables. As an example, one respondent states:
As crime goes down, the pressure to maintain it got great . . . it was a numbers game . . . promotions were based on favouritism and nepotism . . .
At the outset, then, we determine the extent to which (if at all) Compstat increases pressure to decrease index crime compared with pre-Compstat management policies. Some studies suggest Compstat enormously increases the pressure on commanders to reduce crime (eg, Eterno, 2001; Eterno & Silverman, 2006; Silverman 2001). However, this may be subject to doubt, since fighting crime is clearly within the mission of all police departments of any era, with or without Compstat.
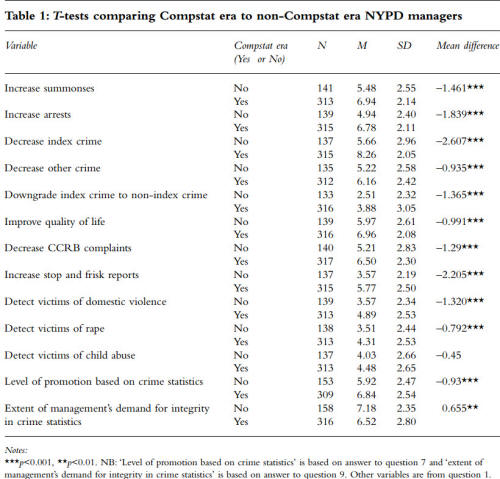
Table 1: T-tests comparing Compstat era to non-Compstat era NYPD managers
The survey questions analysed here are based on a 1 to 10 scale. For this first analysis, ‘1’ corresponds to ‘least pressure’ to reduce crime and ‘10’ corresponds to ‘most pressure’. We find that, on average, retirees who worked after 1994 (the Compstat era) felt far more pressure to decrease index crime (M = 8.26, SE = 0.116) compared with those who worked in 1994 and before (M = 5.66, SE = 0.253). This difference is statistically significant: t (195.081) = –9.369, p<0.001.10 We take the added step of calculating the size effect using the formula:
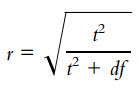
Our calculations indicate that these data represent a large size effect (r = 0.557).11 Clearly, those working in the Compstat era felt much more pressure to reduce index crime compared with those who worked in earlier years.
Next, we examine the extent to which commanding officers felt that their promotions were based on crime statistics. On average, those retirees who worked after 1994 were more likely to feel that promotion was based on crime statistics (M = 6.84, SE = 0.144) compared with those who retired earlier (M = 5.92, SE = 0.199). This difference is statistically significant: t (460) = 3.739, p<0.001 and represents a small size effect (r = 0.172). This finding is consistent with the previous result; namely, those working in the Compstat era feel more pressure to reduce crime, which is also reflected in their views of promotional opportunities.
Another important comparison of means examines management’s demand for integrity in crime statistics. One might assume that integrity would be the same regardless of the era. Our data, however, indicate that, on average, those who worked after 1994 felt less demand for integrity in crime statistics (M = 6.52, SE = 0.157) compared with earlier retirees (M = 7.18, SE = 0.187). This difference is statistically significant t (366.322) = 2.678, p<0.01 and represents a small size effect (r = 0.138). So, according to this survey, demand for integrity in the crime statistics was significantly weaker during the Compstat era.
Overall, these bivariate findings clearly demonstrate that pressures from management are significantly different in the Compstat era. First, all but one variable show significantly more pressure on Compstat era managers. The one variable that did not show a statistically significant difference was detecting victims of child abuse. Second, the pressure to reduce index crime is particularly striking given the size effect of 0.557. Such a large size effect — rare in social science — indicates that perceived pressure to reduce index crime during the Compstat era is pronounced. Third, the one variable that shows significantly less pressure in the Compstat era is management’s demand for integrity in crime statistics.
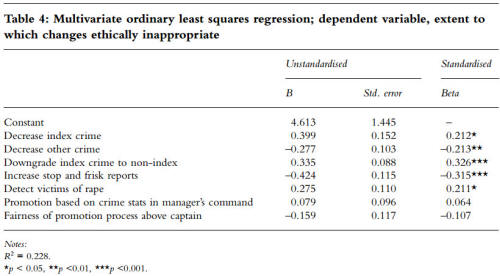
The significant Compstat pressures to reduce crime, stress crime statistics for promotion, and the weakened demand for integrity in crime statistics heighten the likelihood that Compstat era commanders might change or modify index crime reports. Consequently, we turn our attention to the possible distortion of crime statistics in the Compstat era. To do this, we first conduct some univariate analyses and then conduct a multivariate regression analysis to attempt to explain unethical changes to crime reports.12
Analysis of Compstat era responses
Based on previous analysis and studies suggesting possible manipulation of crime reports due to Compstat (Eterno, 2003; Eterno & Silverman, 2006), we examine data specifically targeted to Compstat era managers regarding changing crime reports.13 We asked respondents to advise if they were aware of any instances in which crime reports were changed specifically due to Compstat.
By design we asked this as a contingency question. This allows us to select out those who know of no changes at all. That is, if respondents were unaware of any changes due to Compstat, it is highly unlikely that they were in a position to observe much of anything since complaints are routinely changed due to Compstat. Many of these changes are completely ethical and appropriate. For example one interviewee, who was a CO of a precinct and we would describe as highly ethical and even very positive about the NYPD, routinely sent out a police officer to look for cars which were reported stolen but were actually parked in a spot that the complainant could not remember.
I actively sent out an officer to fix the numbers. If a car was reported stolen but was actually parked in a spot that the person could not find the car, well that had to be corrected. It was a matter of accuracy to be reflected in the Compstat figures.
Thus, if a respondent was completely unaware of any changes, even ethical ones, that person clearly was not in a position (ie, work assignment) to observe much of anything with respect to crime numbers. The contingency question, therefore, has the advantage of exposing those respondents who were in positions to observe changes — without having them reveal information about their assignments — helping the researcher to maintain anonymity (and, consequently, validity) while as the same time collecting important information.
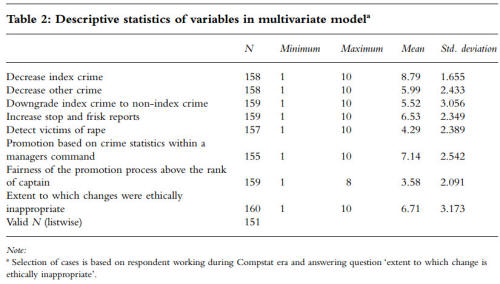
Of those who worked in the Compstat era and responded to the question, over half (51 per cent) of the 309 responses indicated they were aware of changes. Since this was a contingency question, it is now possible (and important) to ask only those who were aware of at least one change, follow-up questions about the change(s). The followup question asks the extent to which the change(s) were ethically inappropriate. To examine this, we grouped responses into low (responses 1–3), medium (responses 4–7), and high (responses 8–10) unethical categories. Since it was a contingency question, there were 160 responses (eliminating those who saw no changes whatsoever — again, very unlikely if the respondent worked in a precinct for any length of time). Of those who observed at least one change in a crime report, over half of respondents (53.8 per cent) indicated that the changes observed were highly unethical. Another 23.8 per cent indicated they were aware of moderately unethical changes. The remainder, 22.5 per cent, indicated that they were aware of ethical changes.14
Our qualitative interviews provide further evidence of perceptions of unethical alterations of reports in the Compstat era. Most interviewees indicated that reports were routinely changed in various ways due to pressure from Compstat.
One C.O. would check book and catalog to look up depreciated value to make it a misdemeanor, same with car parts. That’s how desperate C.O.s would get. [They would] go to [the] scene where index crime occurred, assess, try to get [the] complainant to change story.
Here we see an example of what Commanding Officers (COs) believe was happening. One example has to do with the cost of stolen items. If a citizen registered a complaint of larceny of property, every attempt was made to determine that the cost of the item would not make the crime a felony (grand larceny is an index crime but petit larceny is not). Regardless of what the complainant stated, unless the complainant had absolute verifiable proof, officers would make every effort to ensure the crime did not meet the level of a felony. Indeed, some retirees advised that going on ‘eBay’ to find an item similar to the one reported stolen but at a lesser price (to make the complaint change to a petit larceny from a grand larceny) was a well-known practice. Interviewees advised of commanders carrying books that stipulate the depreciated value of items. Also, getting complainants to change stories can be seen in the above quote.
We see other examples over and over again. One interviewee stated:
There was full adherence to penal law, very literal interpretations. They would surf the internet to find a bicycle price, question victims to ensure it was an index offense . . . COs were driven to reading the letter of the law.
Yet another:
It was a matter of spiking [ie, a sharp increase in crime] then apply the letter of the law . . . try to find something to ‘legitimately’ knock down crimes.
Thus, the interviewees felt that every effort was made to ensure that a complaint of an index crime exactly conformed to the New York State Penal Law section’s rules for that crime. Such practices are not technically wrong but they are certainly practices that impact interpretation of crime statistics.
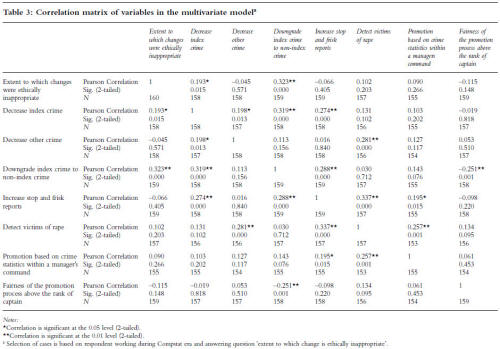
Clearly, the evidence thus far suggests that members of the NYPD have, at times, unethically altered complaint reports (see also Eterno, 2003, p. 114; Eterno & Silverman, 2006). What would induce commanders to resort to such legerdemain? To explain further and add evidence to this issue, we conducted a multivariate analysis.